![]()
A Reliability Assessment Tool For NDT Inspection Systems
STATUS 5 measures the reliability of an inspection system to detect specified flaw sizes based on statistical analysis of imported data. The user-friendly software is an essential NDT tool for generating Probability of Detection (POD) curves, optimization plots and summary tables, tailored for technicians with a limited knowledge of statistics.
Driven by an intuitive user-friendly interface, Status 5 instantly generates visualized data as POD curves using the statistical analysis methods of â vs. a, Logit, Probit, LogLog, CLogLog and Nordtest Models.
Users can optimize input and compensate for system noise with minimal statistical knowledge using the Noise Study and Threshold Optimization Tools. Status 5 also includes Sizing Accuracy and optimization tools to calculate flaw sizing capabilities and provide assistance.
- Overview
- Advantages
- Probability Of Detection
- Nordtest
- POD Optimization Tools
- Sizing Assessment Tools
- STATUS 5 is a convenient NDT tool for assessing the efficiency and reliability of NDT techniques and evaluating operator performance.
- The software generates Probability of Detection (POD) curves for all NDE systems, based on statistical analysis of data imported by the user.
- STATUS 5’s Sizing Accuracy study assists the user’s NDT technique by comparing actual flaw sizes, reported after destructive testing, to the user’s flaw sizing capability.
- The Sizing Optimization tool provides guidance to optimize calibration curves implemented from the acquisition system and increase the sizing accuracy based on your specifications.
- Five statistical models available for POD curve generation, including an automated model recommendation based on the most efficient POD curve using the operators imported data.
- Data View, Chart View and Split View available.
- Inspection Data and Actual Test Data columns show defect’s length, depth and height.
- Data filtering capability.
- Defect’s ID, side, zone and type information shown in columns.
- Recommendation tab and study list.
- User-friendly interface with a highly visualized presentation.
- Facilitates quick importing/exporting of Excel documents or manual data entry.
- Fast and intuitive to use with extensive help and guidance, tailored for operators with a minimal mathematical background and statistical knowledge.
- Five statistical models (â vs. a, Logit, Probit, LogLog, CLogLog) available for POD curve generation, including an automated model recommendation based on the most efficient POD curve using the operators imported data.
- Noise Study and Threshold Optimization tools efficiently adjust POD model inputs based on inspection system properties.
- Defects sizes and amplitudes used with regard to threshold and saturation amplitudes.
- Separate POD curves can be generated based on defects length, height and depth.
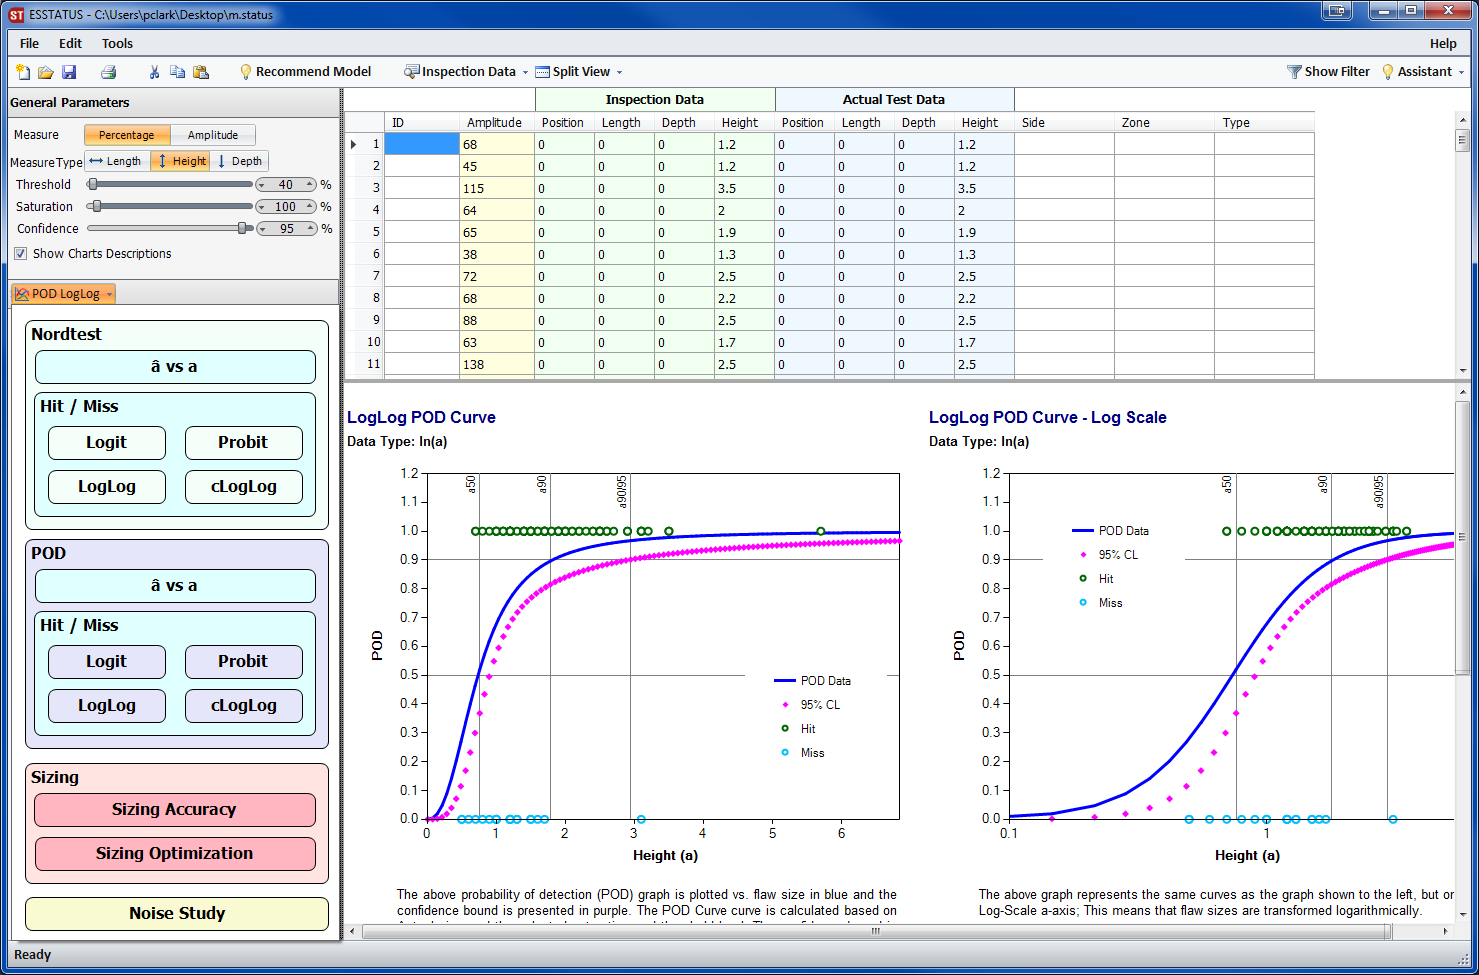
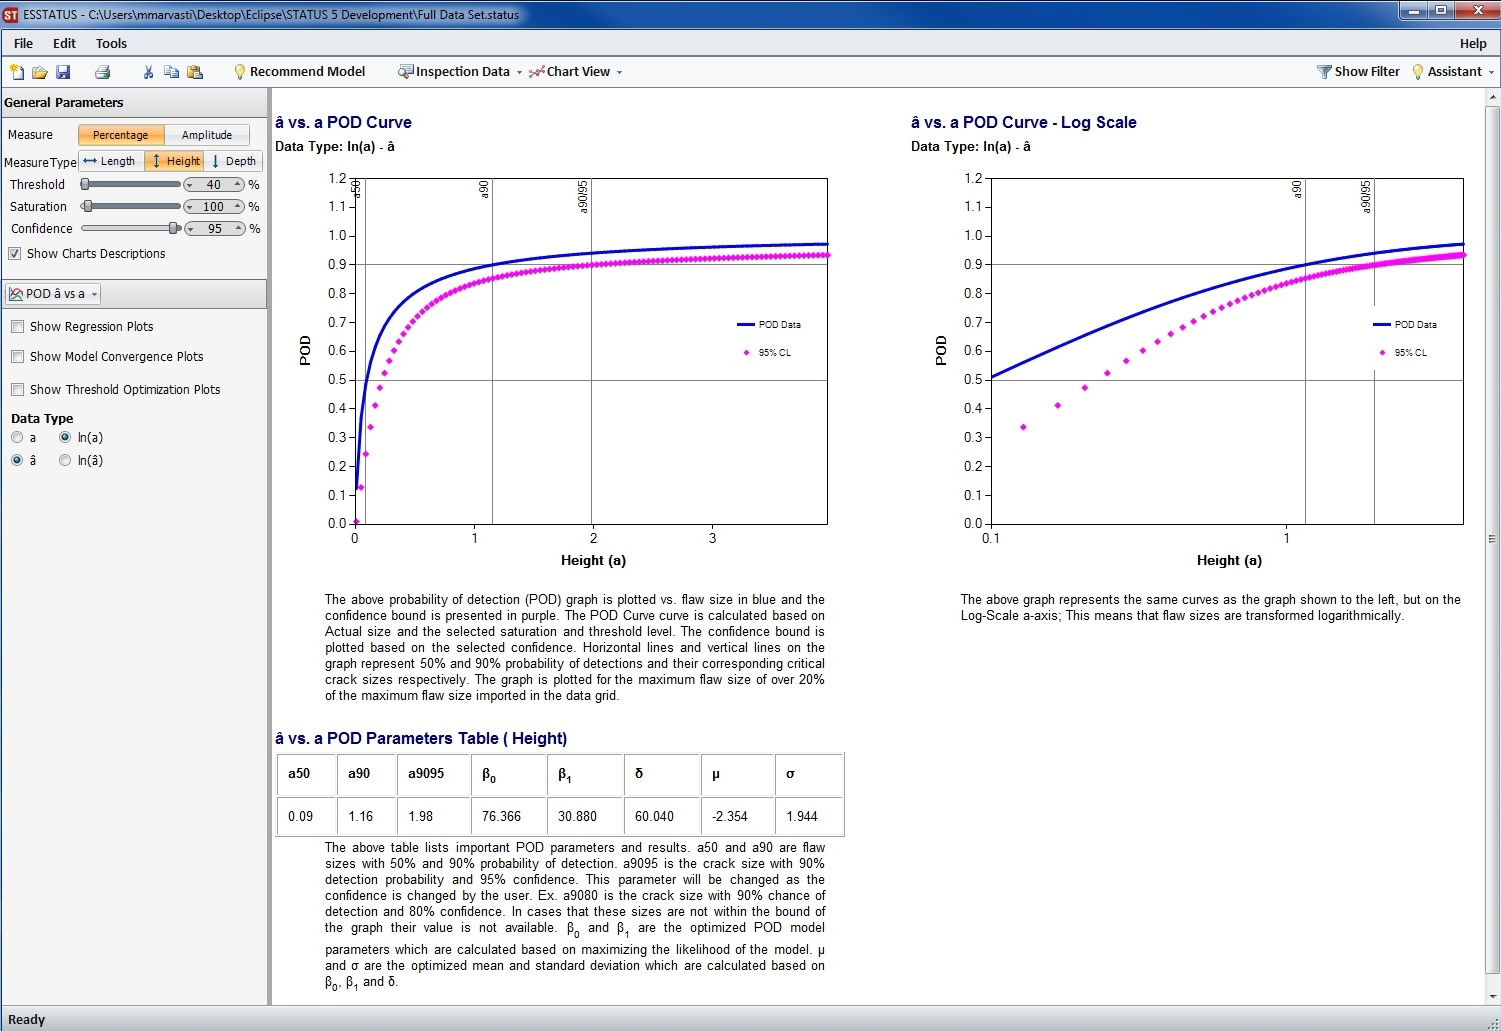
- POD and confidence curves available on both Cartesian and log-scale plots.
- Critical defect sizes are specified on the graphs by vertical lines and listed in a summary table.
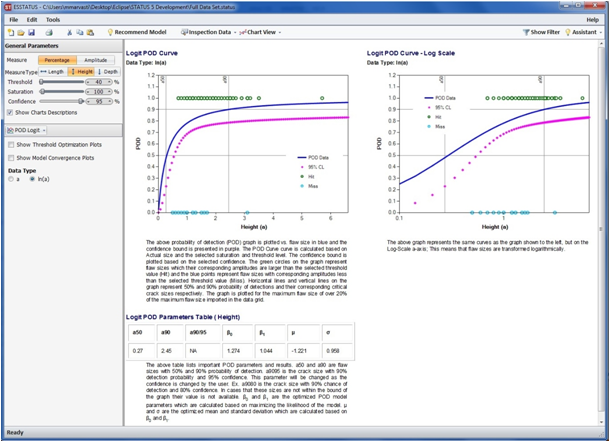
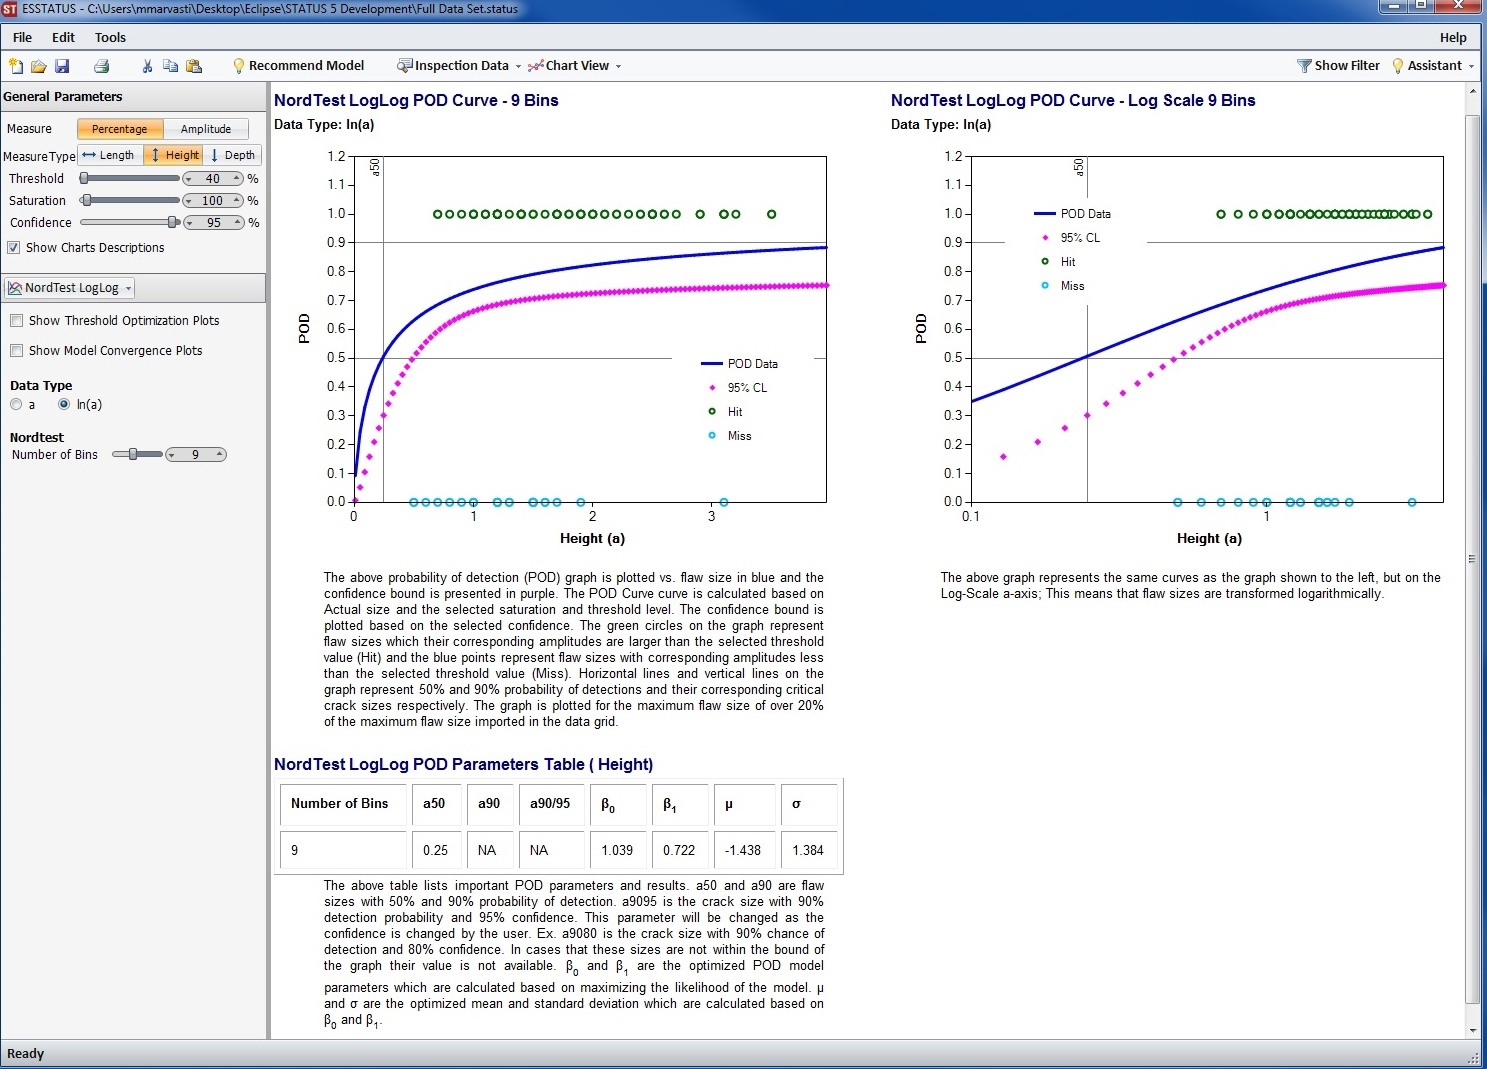
- POD curves are generated based on Hit (1, green points) and Miss (0, blue points) data.
- Separate POD curves can be generated based on the defect’s length, height and depth.
- POD and confidence curves available on both Cartesian and log-scale plots.
- Critical defect sizes are graphed by vertical lines and listed in a summary table.
- Instant analysis and comparison of all 5 models (â vs. a, Logit, Probit, LogLog, CLogLog) utilized in 12 settings.
- Automatically recommends the most efficient POD model based on AIC values.
- Data fit quality to all POD models is evaluated using BIC values.
- The user is directed to the recommended model with optimized parameters at the click of a button.
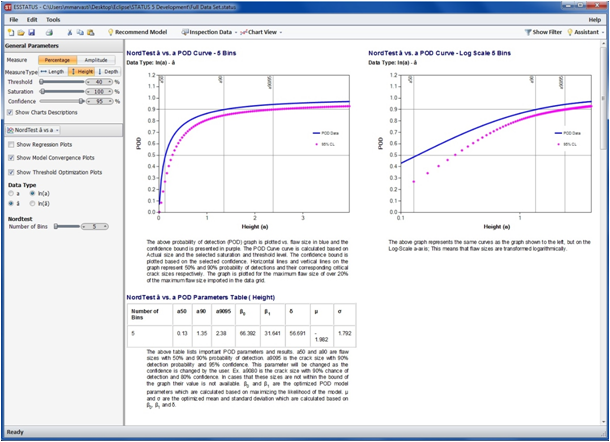
- Imported data can be grouped in the selected number of bins for POD curve generation.
- 5 to 15 bins can be selected by the user.
- POD and confidence curves available on both Cartesian and log-scale plots.
- Critical defect sizes are specified on the graphs by vertical lines and listed in a summary table.
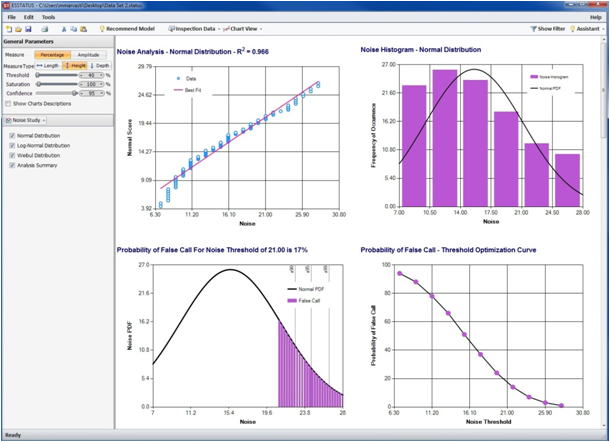
- An instrument’s noise data can be imported to the software.
- Noise statistical distribution is obtained as compared to normal, weibull and log normal distributions.
- Probability of False Call is calculated for different values of threshold based on the noise statistical distribution.
- Critical defect sizes are specified on the graphs by vertical lines.
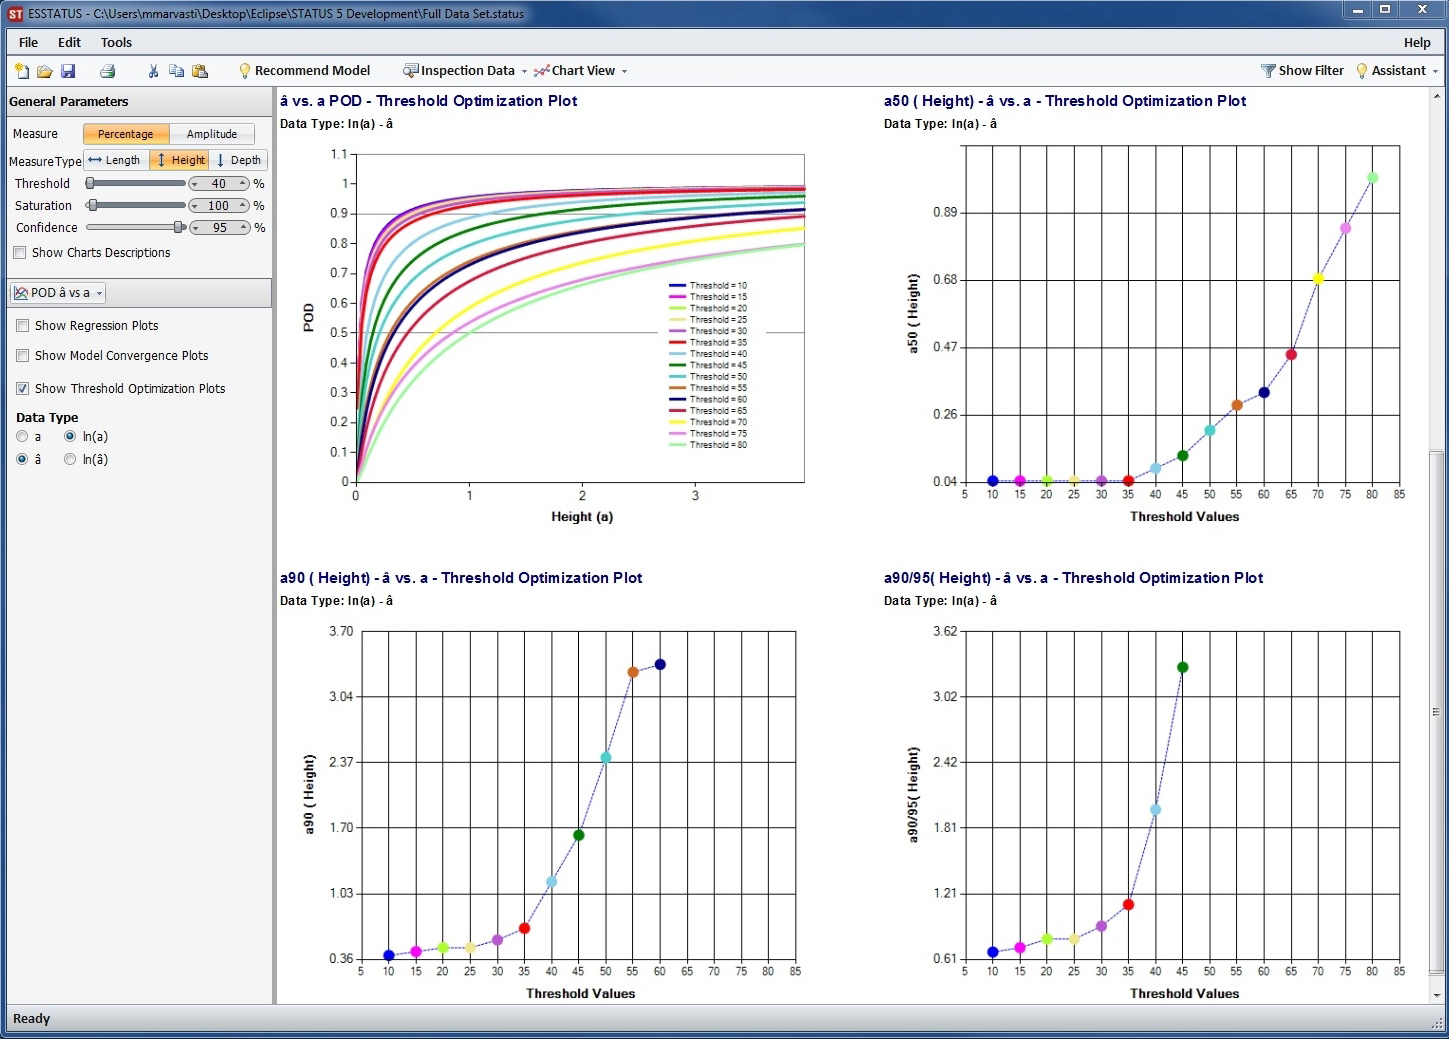
- Effect of threshold value on the shape of the POD curves can be analyzed graphically.
- Various colours can be used to plot POD curves generated by different thresholds, providing a clear comparison on the same graph.
- Effect of threshold values on the values of critical flaw sizes are analyzed in separate graphs.
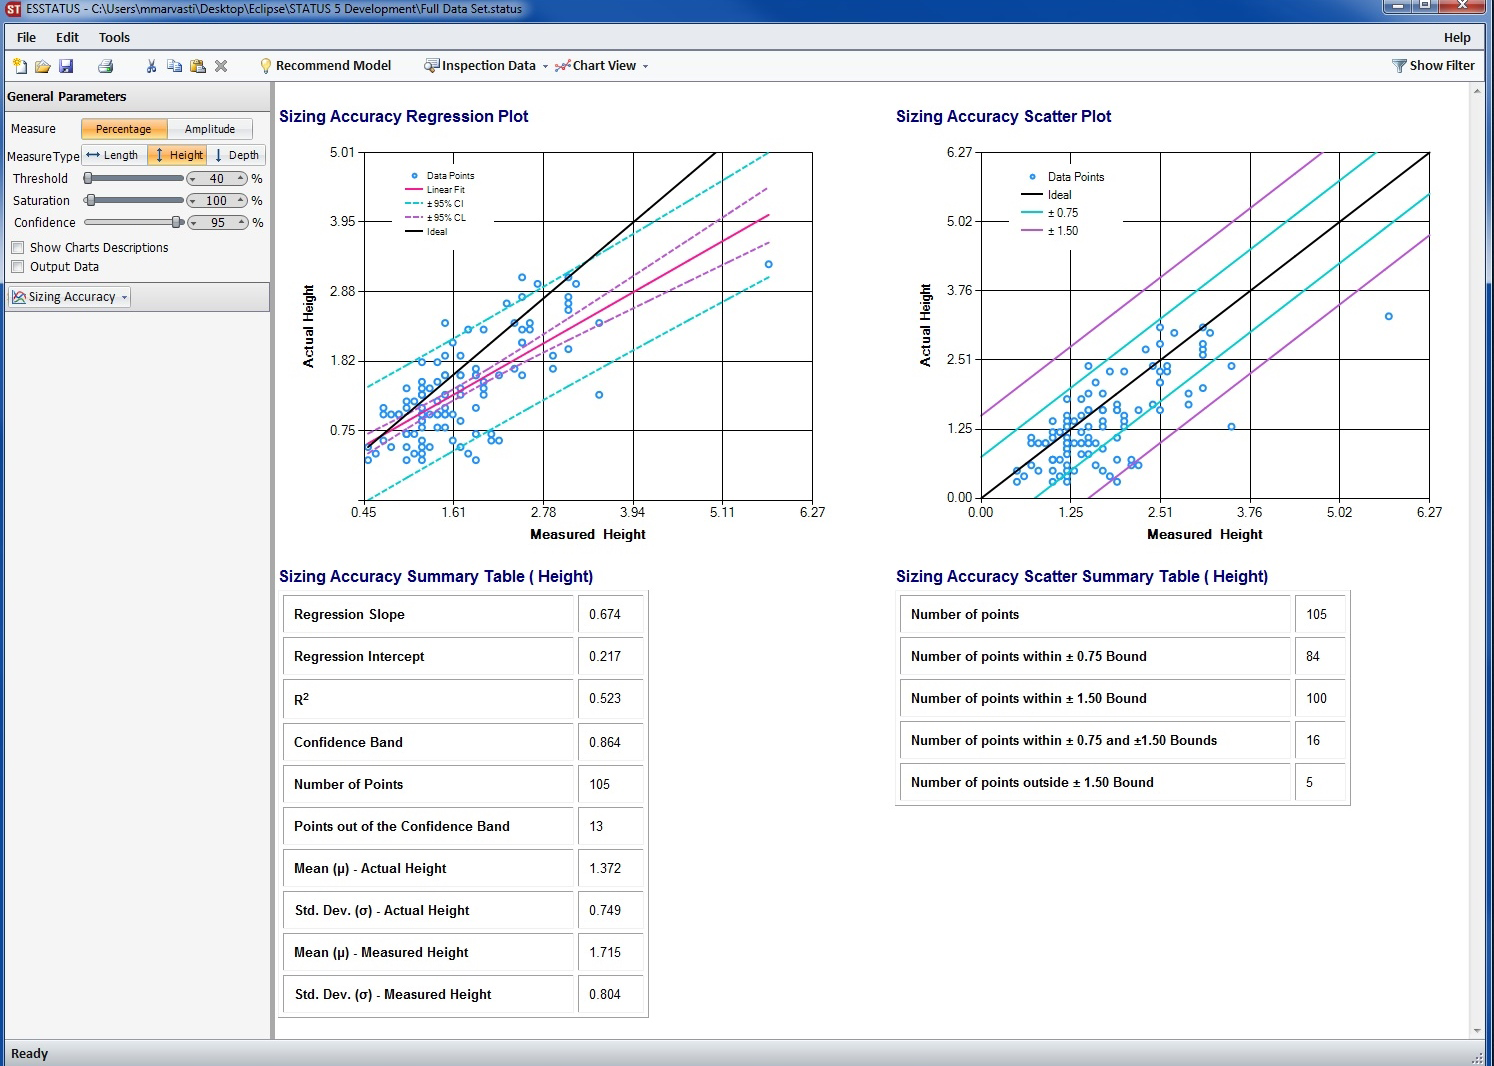
- Measured defect sizes are compared to actual sizes for sizing accuracy assessment.
- Sizing regression fit compares estimated defects sizes with the ideal actual defect size.
- Sizing scatter plots are provided to compare actual defect’s sizes to the measured flaw size scatter.
- Sizing regression and scatter plot results are summarized in tables with key information.
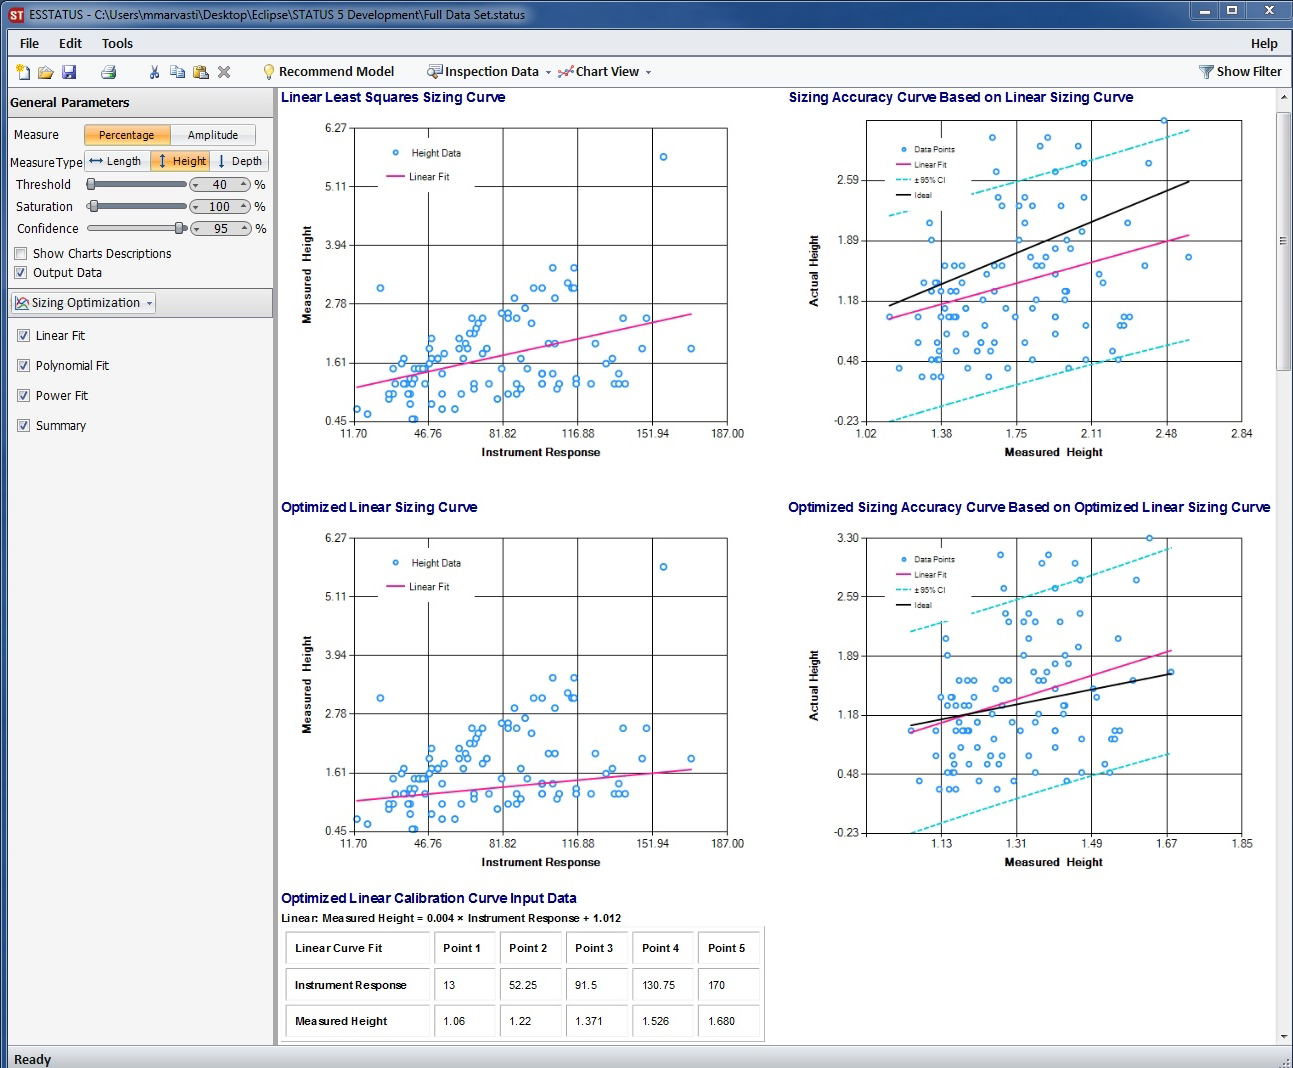
- Recommends the optimum calibration curve fit formula comparing linear, polynomial and power fits.
- Calculates the optimum calibration curve to be used in the instrument for sizing.
- Optimum calibration curve usage results in defect’s size measurements match more closely to actual sizes.
- Optimum calibration curve formula and instrument data import table is provided.

Major Advantages
â vs. a POD
Hit/Miss PODs
POD Model Recommendation

Nordtest â vs. a POD and Hit/Miss PODs
Noise Study
Threshold Optimization
Sizing Accuracy
Sizing Optimization
For more information, email us at
pod@eclipsescientific.com
or call (519) 372-1831 and ask for
Status Support